
This guide walks you through navigating to Xepto Insight within the Xepto Learning Management System (LMS) and using its analytics dashboards.
Step-by-Step Navigation
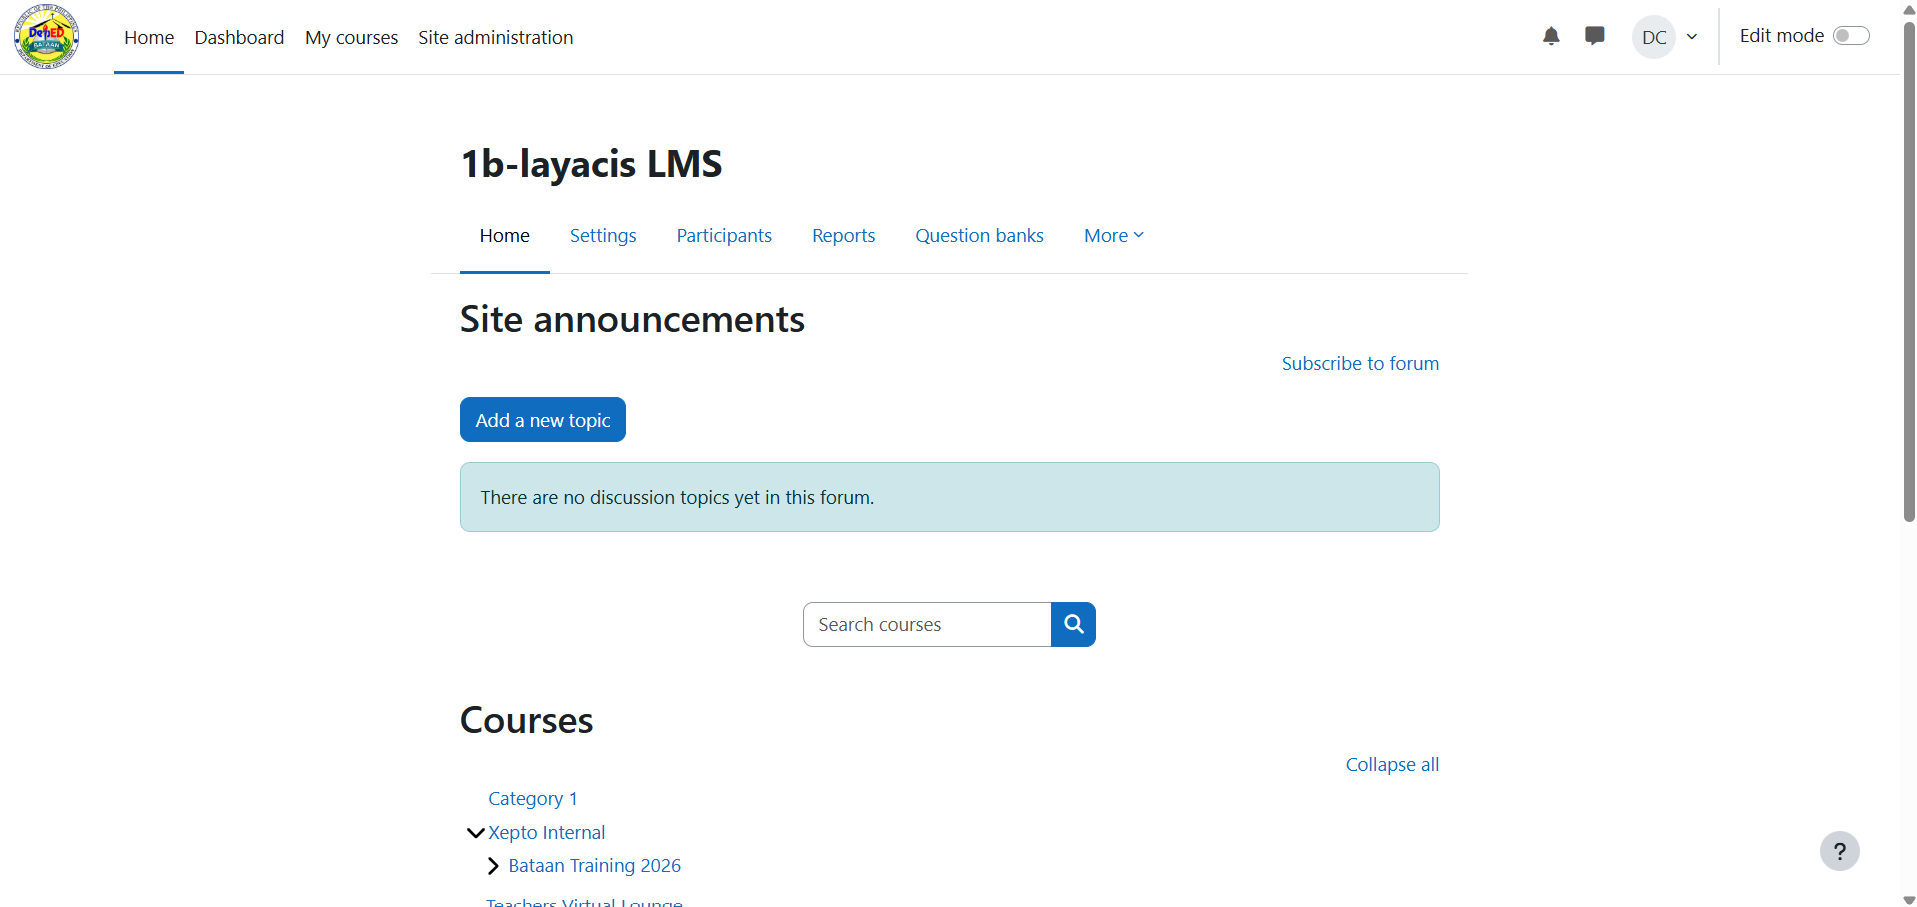
Log in to your Xepto LMS account. From the top navigation menu, select Site administration.
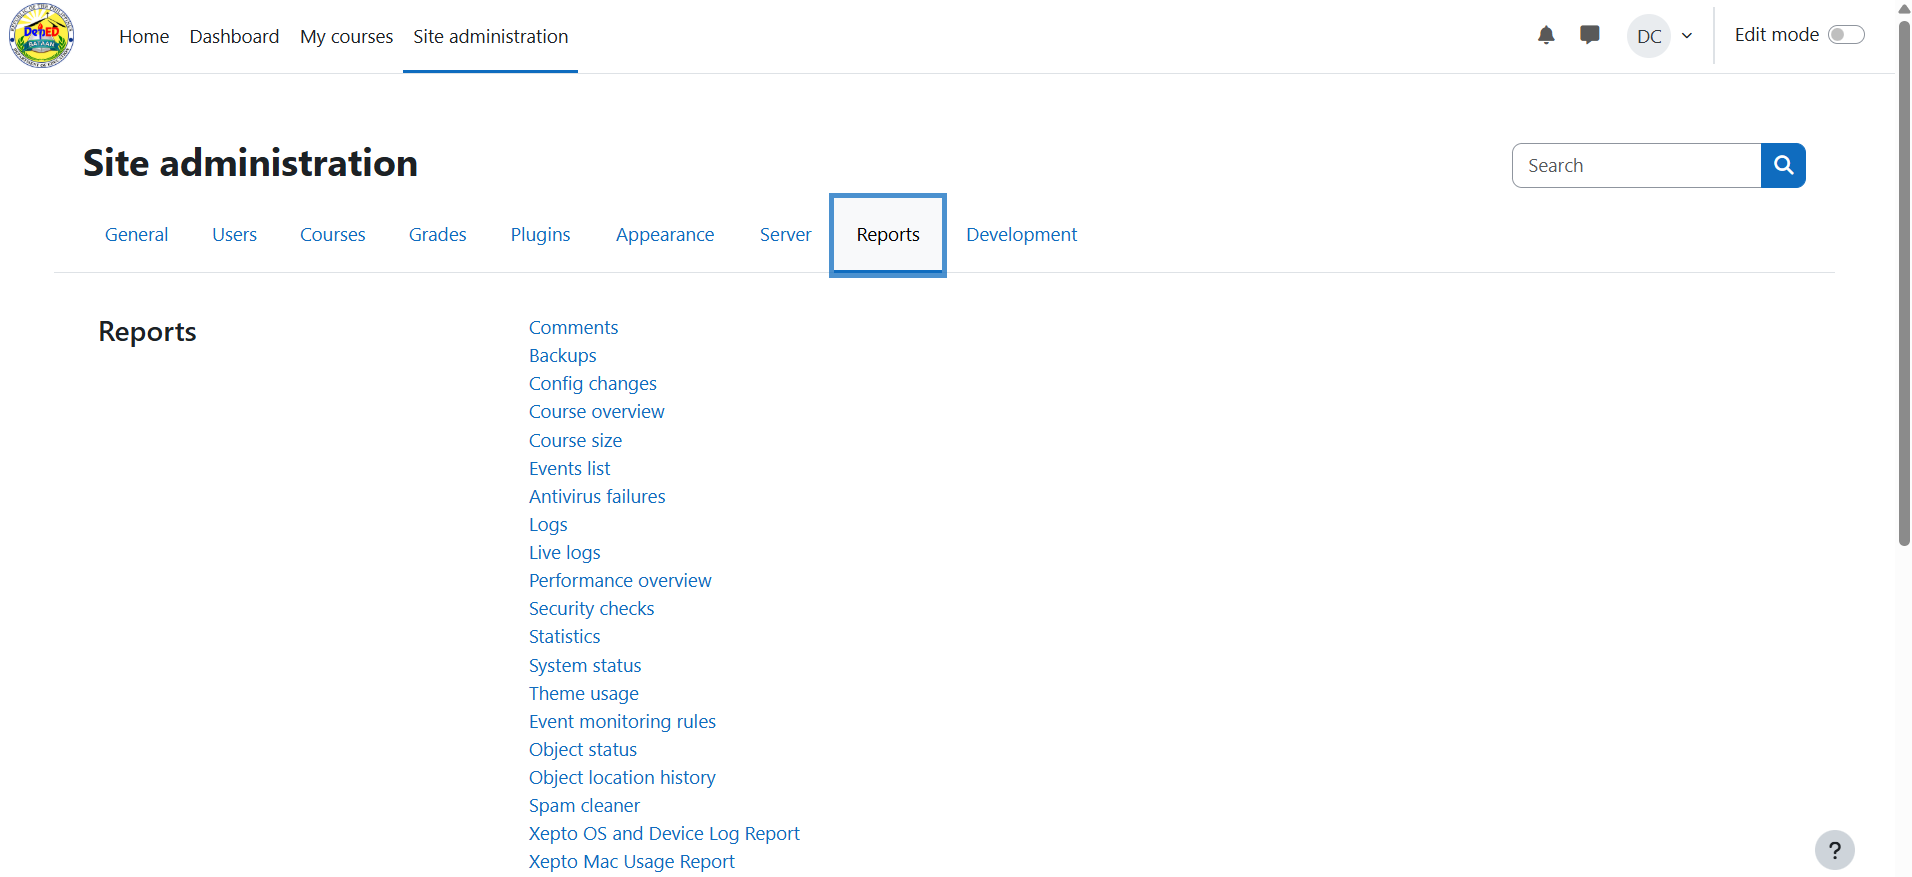
Under the Site administration menu bar, click on the Reports tab.
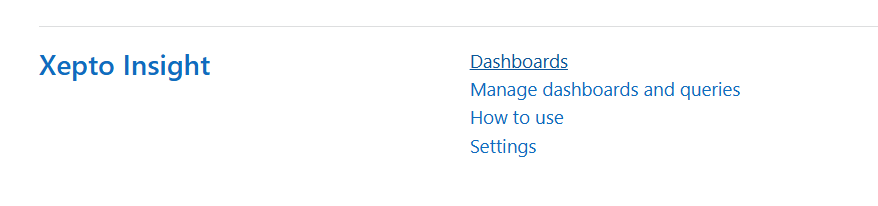
Scroll down to locate the Xepto Insight section and click on Dashboards.
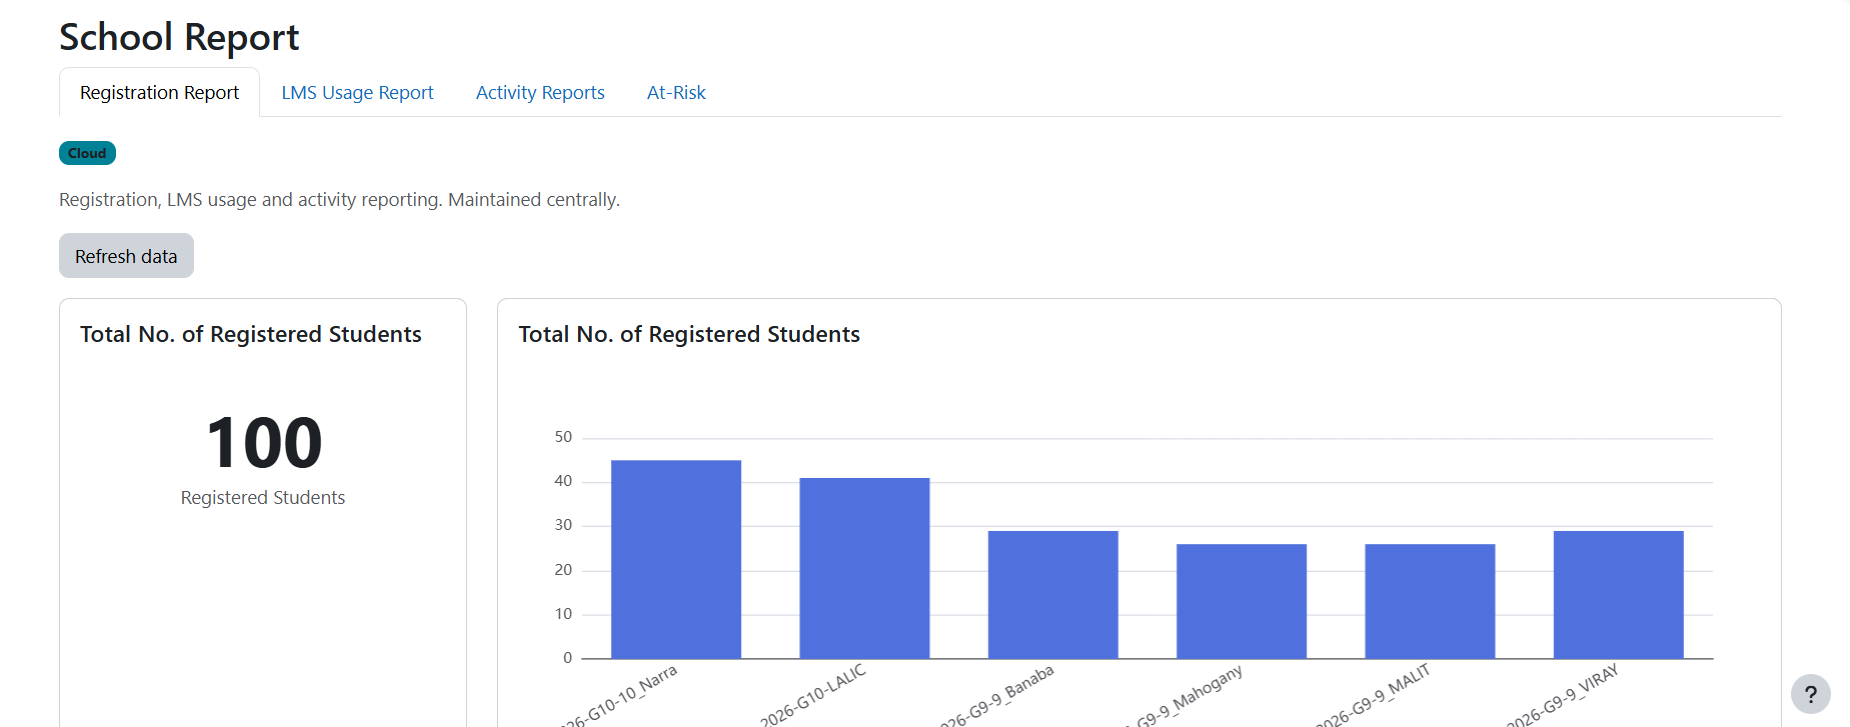
You will be redirected to the School Report section within Xepto Insight, where you can access various reporting tabs.
Available Xepto Insight Reports
1. Registration Report
Tracks learner enrollment and distribution across sections or classes.
Key Metric: Total Number of Registered Students.
Visualization: Bar chart displaying student counts grouped by section/class code (e.g.,
2026-G10-10_Narra,2026-G10-LALIC).
2. LMS Usage Report
Provides high-level system utilization data.
Key Metrics:
Total Logins
Total Views (Reads)
Total Posts (Writes)
Total Engagement Hours
Visualization: Weekly User Login activity tracking.
3. Activity Reports
Monitors activity trends and learner engagement over time.
Visualization: Weekly activity trends across the term (e.g.,
Week 1throughWeek 15), showing peaks and drops in participation.
4. At-Risk Report
Identifies students who may require intervention based on performance and activity criteria.
| Component | Weight | Description |
| Grades & Performance | 35% | Course Total % for the term — strongest direct indicator of risk. |
| Missed Assignments | 30% | Share of assignments submitted in the last 14 days. |
| Attendance | 30% | Days present out of total class days in the last 14 days. |
| LMS Engagement Hours | 5% | Time spent in the LMS relative to class median (filters idle login time). |
Risk Status Categories:
Low Risk Count: Students performing adequately across all metrics.
Needs Attention Count: Students showing minor warning signs in submission or performance.
Urgent Intervention Count: Students meeting critical threshold criteria across multiple weighted components.