
This guide walks you through navigating to Xepto Insight within the Xepto Learning Management System (LMS) and understanding the available reporting dashboards based on the provided LMS walkthrough screenshots.
1. Step-by-Step Navigation Guide
Access Site Administration: Log in to your Xepto LMS portal. From the main top navigation menu (alongside Home, Dashboard, and My courses), click on Site administration.
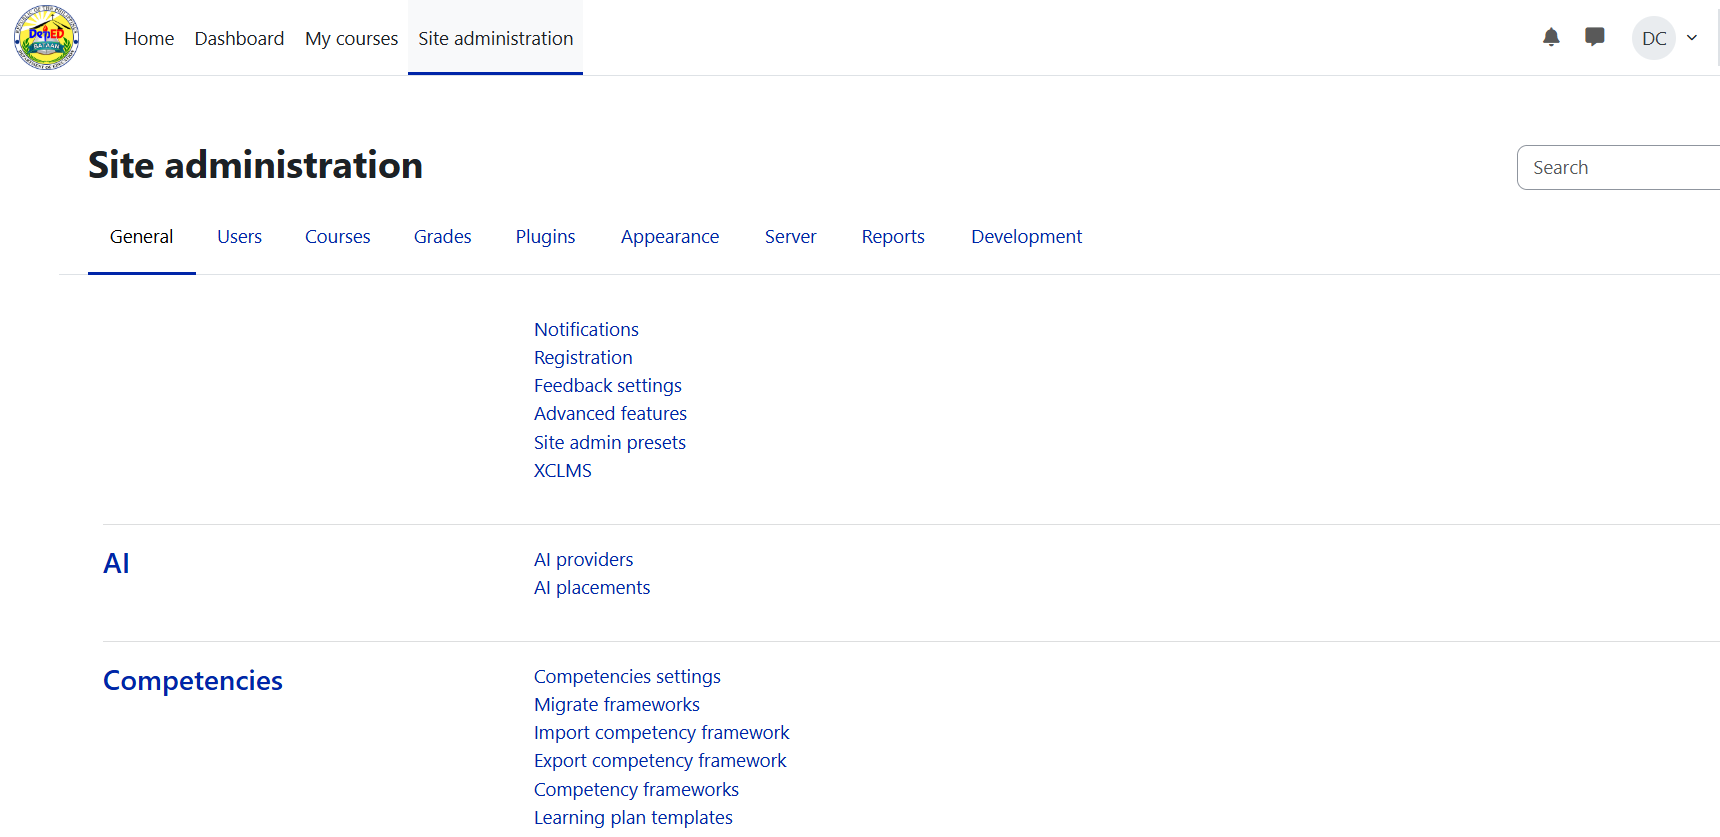
Navigate to the Reports Section: Under the Site administration sub-navigation bar, select the Reports tab.

Open Xepto Insight Dashboards: Scroll down the list of reporting tools to find the Xepto Insight section, then click on Dashboards.

Access School Reports: Once loaded, you will arrive at the main School Report interface featuring multiple reporting tabs.
2. Xepto Insight Report Overview
The Xepto Insight suite provides four main reporting tabs for school performance and usage analytics:
A. Registration Report
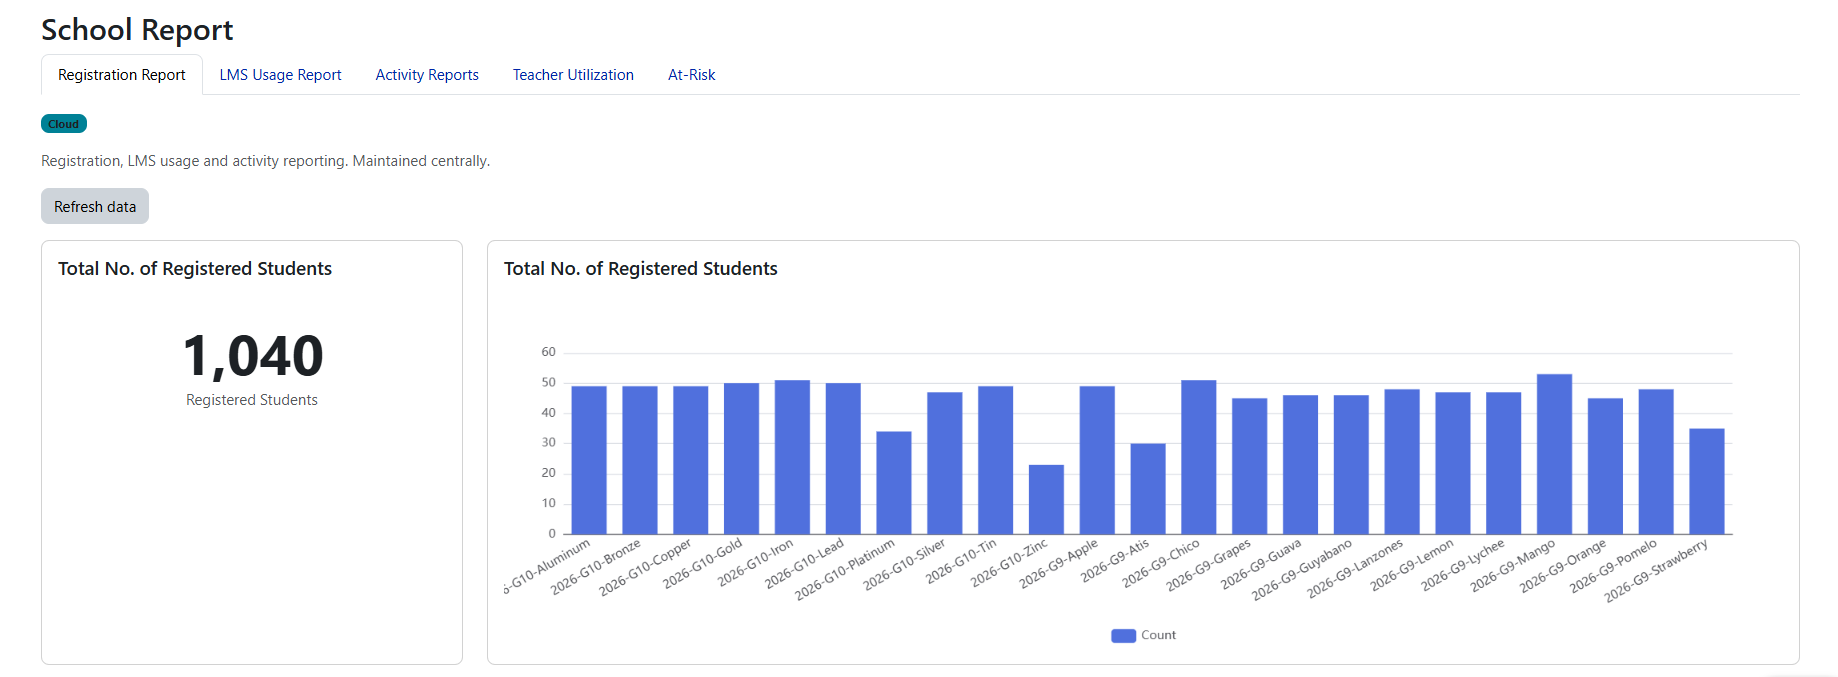
Provides an overview of student enrollment across various grade levels and class sections.
Total No. of Registered Students: Displays the aggregate count of registered students in the system (e.g., 100 students).
Section Breakdown: A bar graph breakdown displaying registration numbers across specific classes/sections (e.g., 2026-G10-10_Narra, 2026-G10-LALIC, 2026-G9-9_Banaba).
B. LMS Usage Report
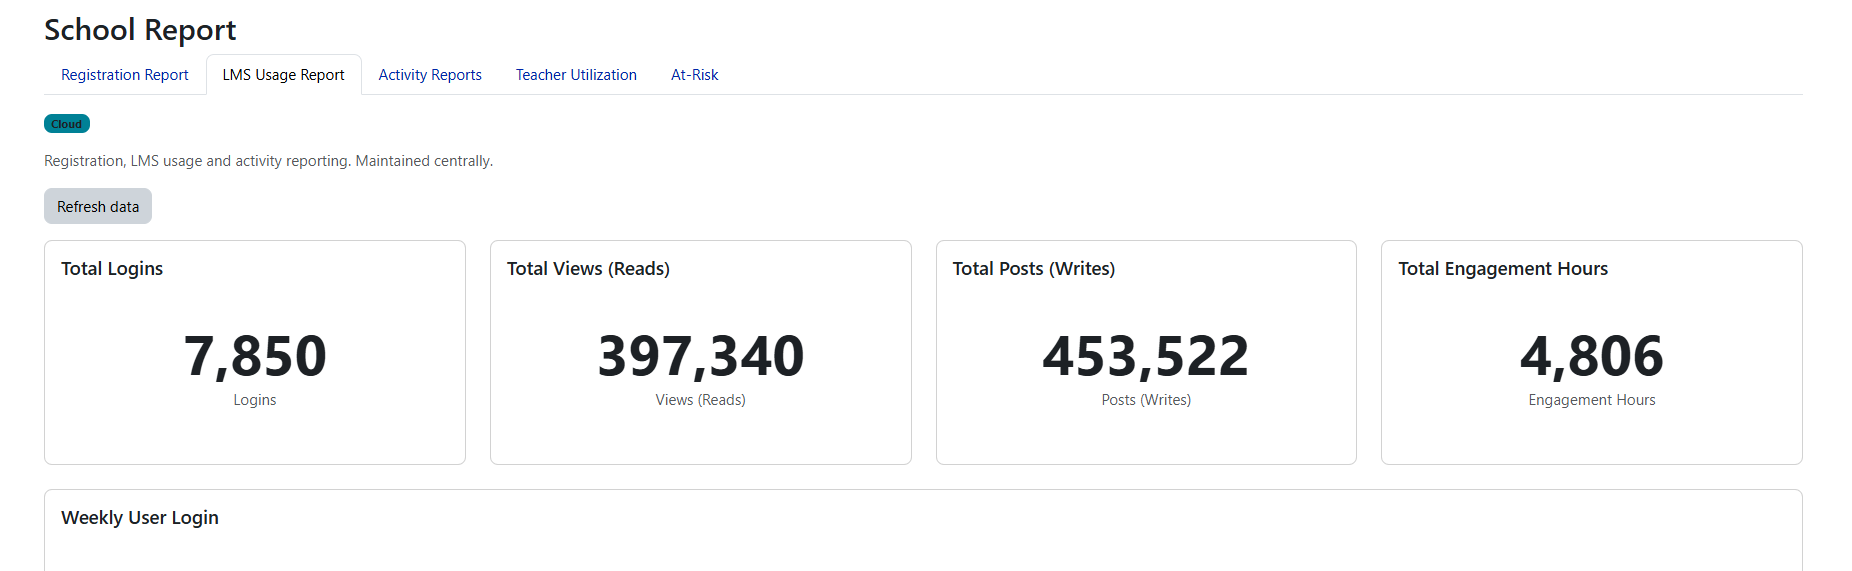
Offers key metrics on user platform engagement and activity levels.
C. Activity Reports
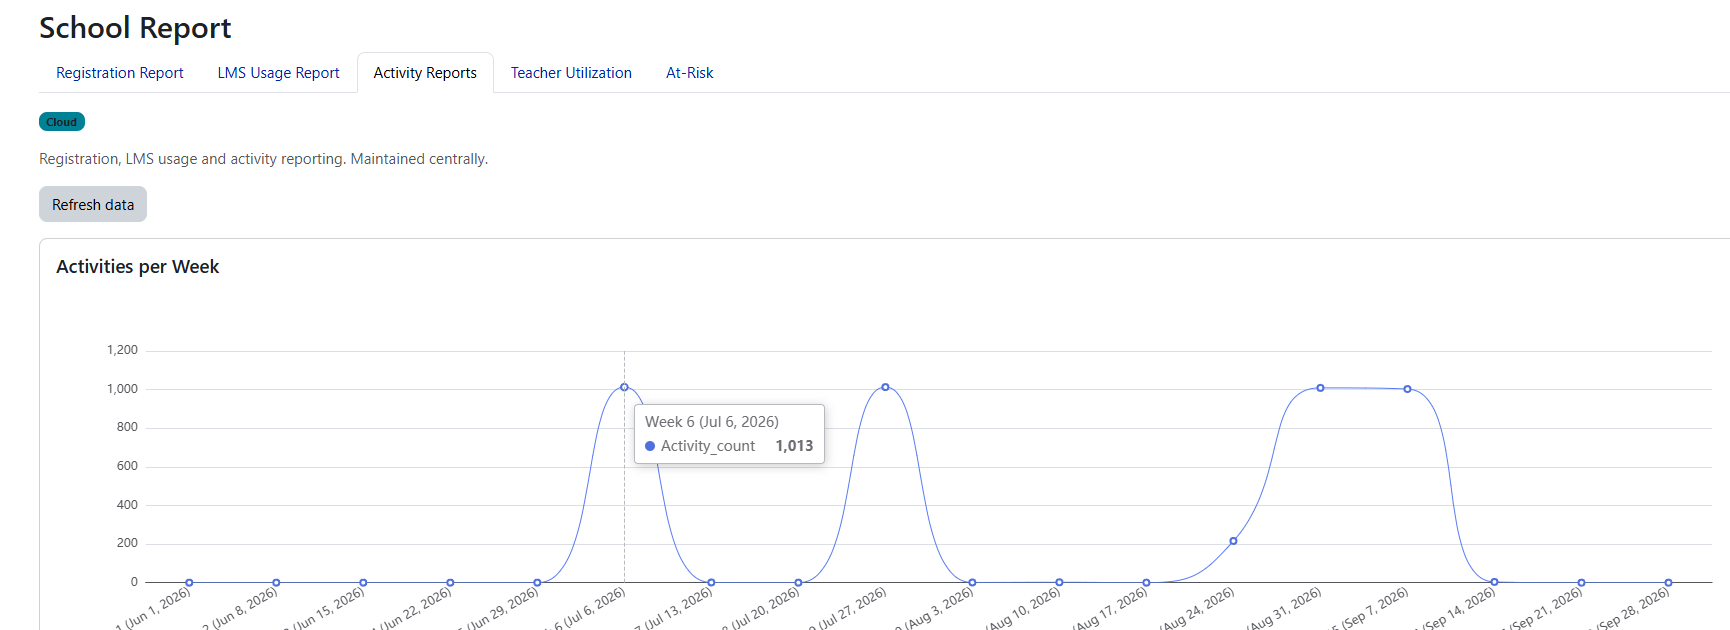
Displays weekly activity level trends over time across the term (e.g., Week 1 through Week 15), identifying peak periods of student activity and engagement drops.
D. Teacher Utilization Report
Monitors instructor activity, activity creation volume, and student interaction rates with teacher-created content.
E. At-Risk Report
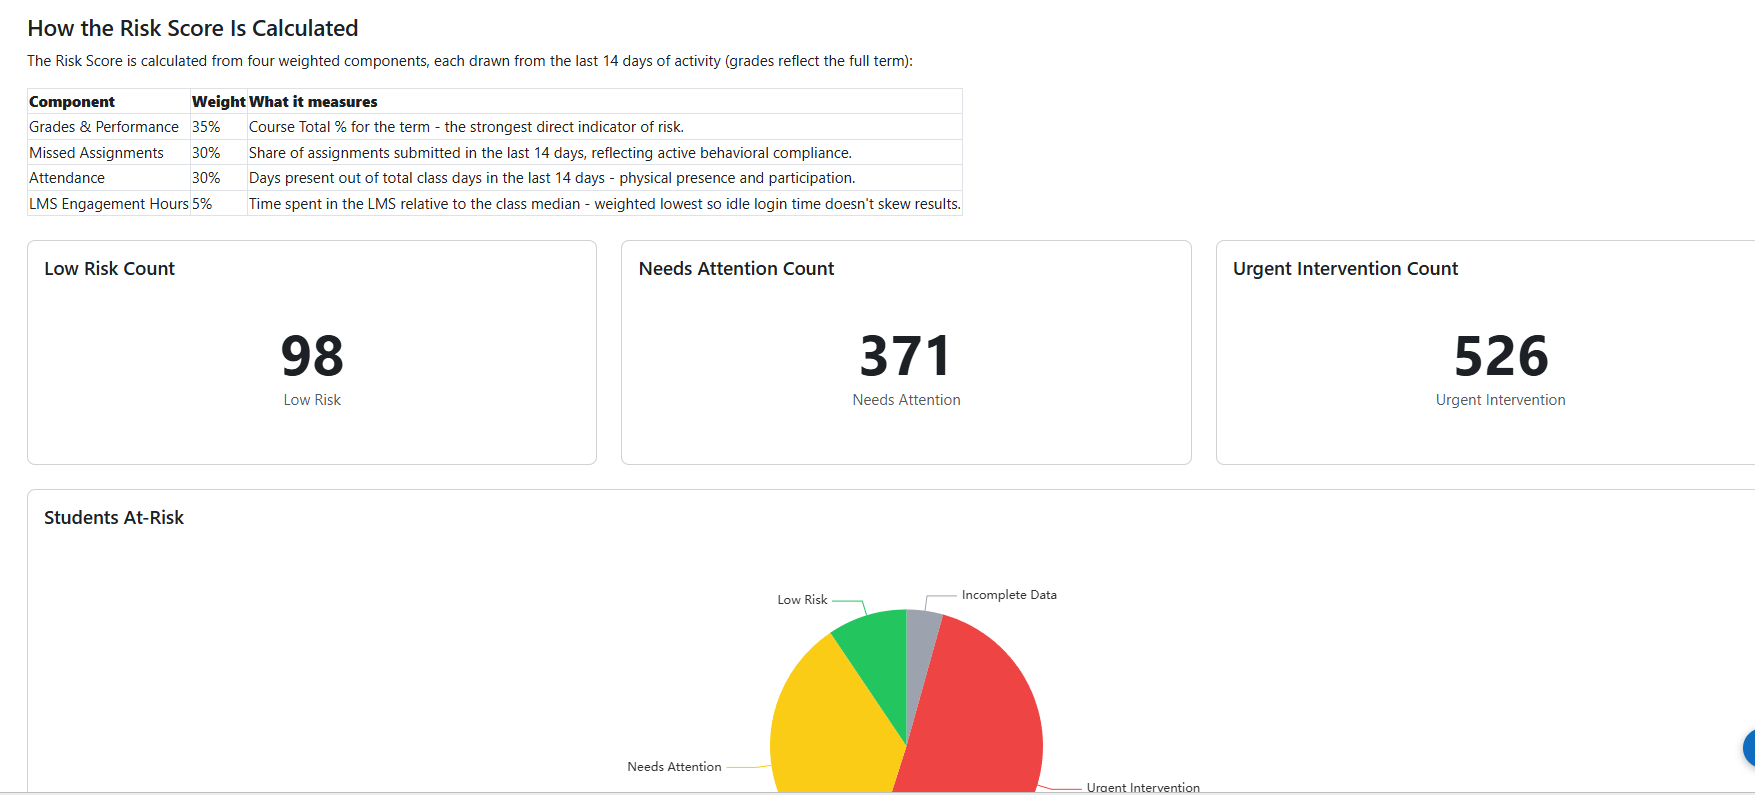
Provides predictive analytics to identify students requiring intervention based on calculated risk scores from the last 14 days of activity.
Risk Score Calculation Components:
Risk Level Categories:
Low Risk Count: Students meeting all academic and participation standards.
Needs Attention Count: Students displaying minor warnings in participation or performance.
Urgent Intervention Count: Students triggering critical risk thresholds requiring immediate academic support.